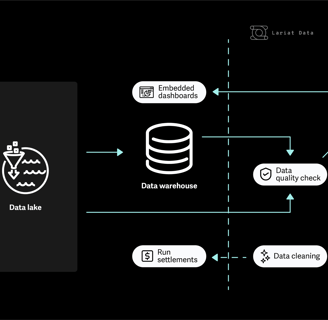
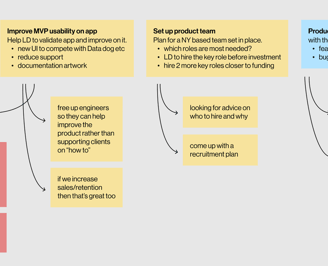
Data monitoring platform
Raised $1.5M in funding and signed clients like Veritonic.
24% higher
$86K saved
83% boost
Over the monthly sales target, on average, and showing improving.


57% reduction in support queries, freeing up engineers' capacity.
Users reported getting more out of the app, resulting in loyal clients.

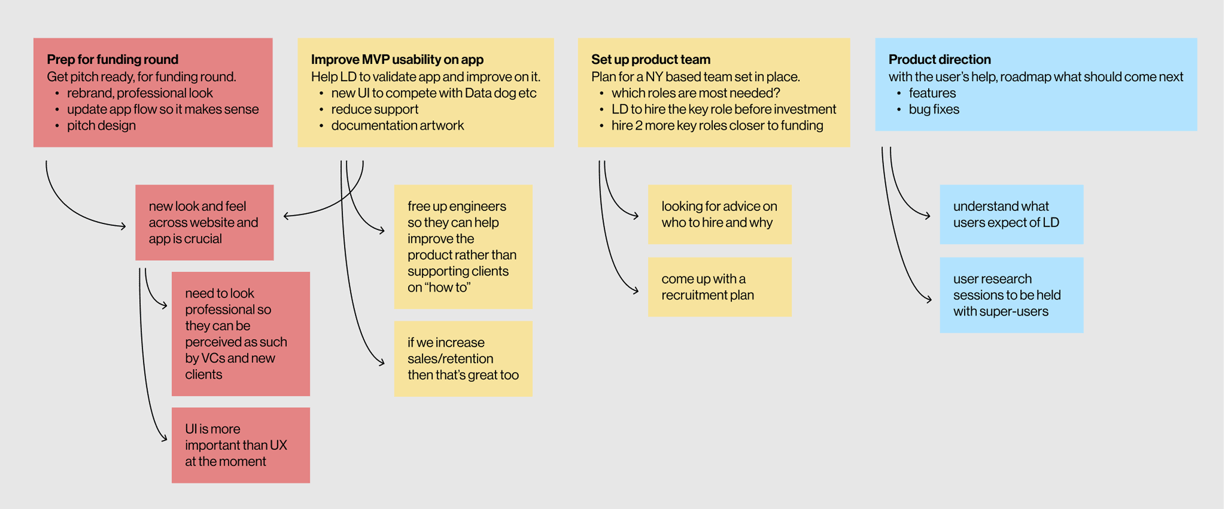
Optimised UX and aligned brand/UI with market trends to drive growth. Strategised recruitment, aligned roadmap to ensure scalability and to capitalise on market opportunities.
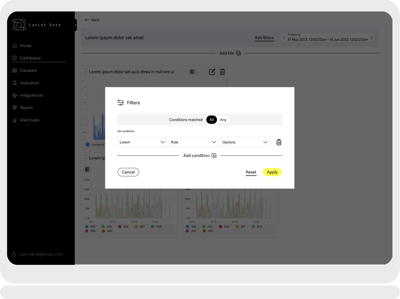
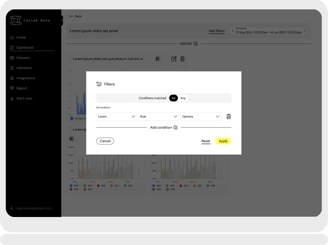
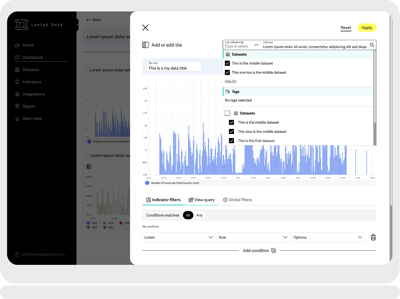
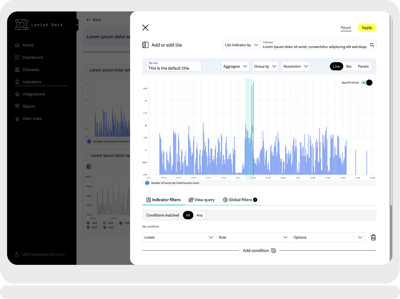
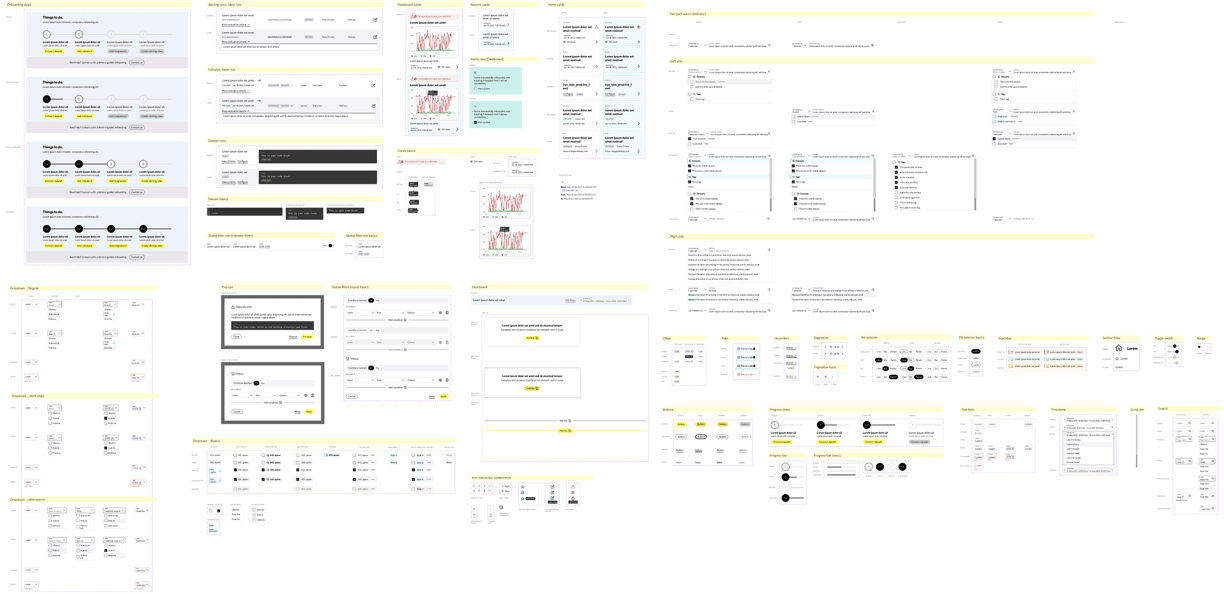
Adding Dashboard filters
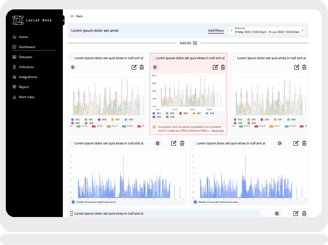
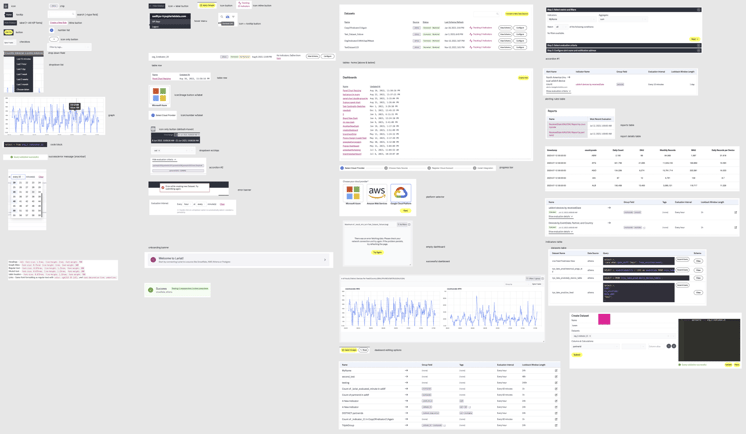
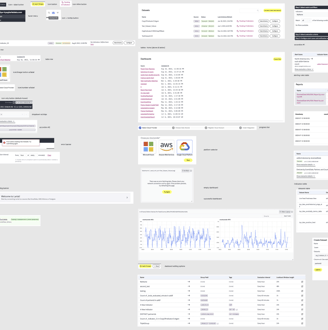
Final designs
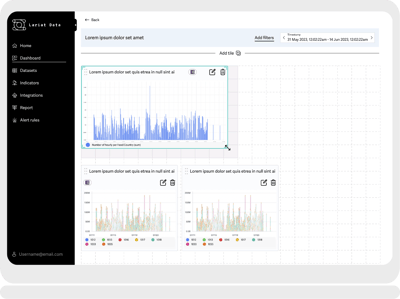
Customising a Data dashboard- data tile resize
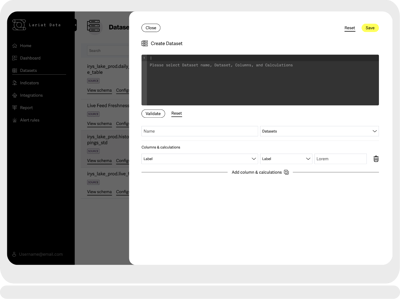
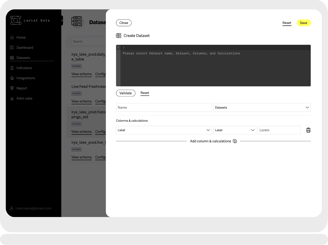
Creating a new Dataset
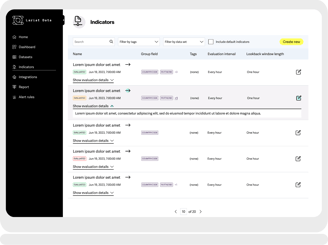
Data Indicators list
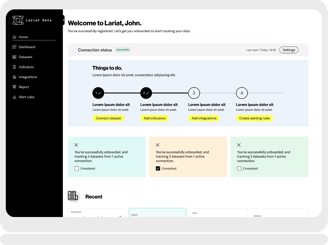
Welcome screen
Empty state for Dashboards


Dashboard data error
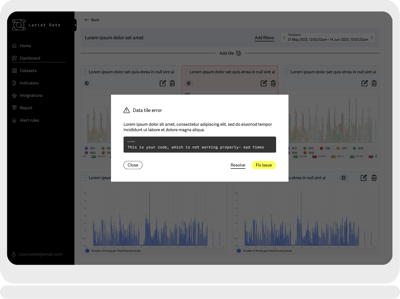

Dashboard error details and AI solution

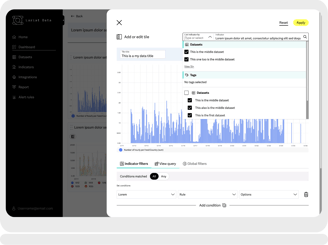
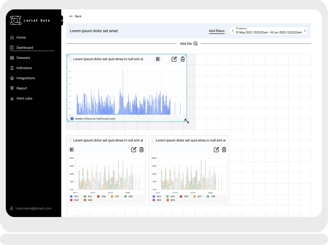
Editing Dashboard data tile
Empty state for Datasets

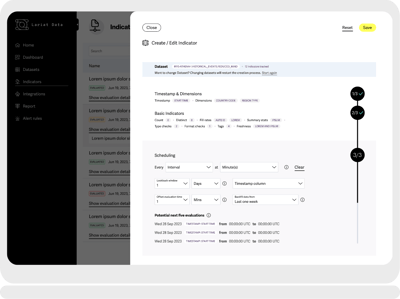
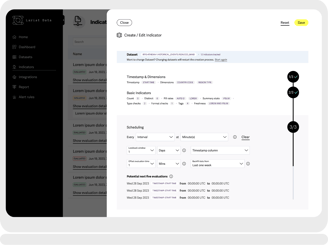
Edit Indicator
Indicator data refresh function- drag select data
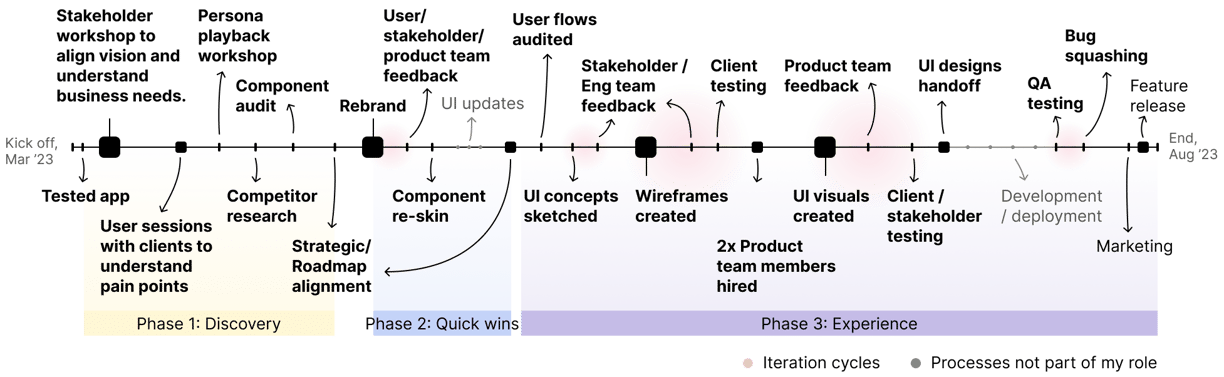
Timeline
Mar 23-Aug 23
Lead Product Designer
Role
Figma, Adobe, VWO, Lookback, Miro, Jira
Tools
Keywords
Mentorship
End-to-end
SaaS
B2B
Start-up
Re-brand
Design system
Context
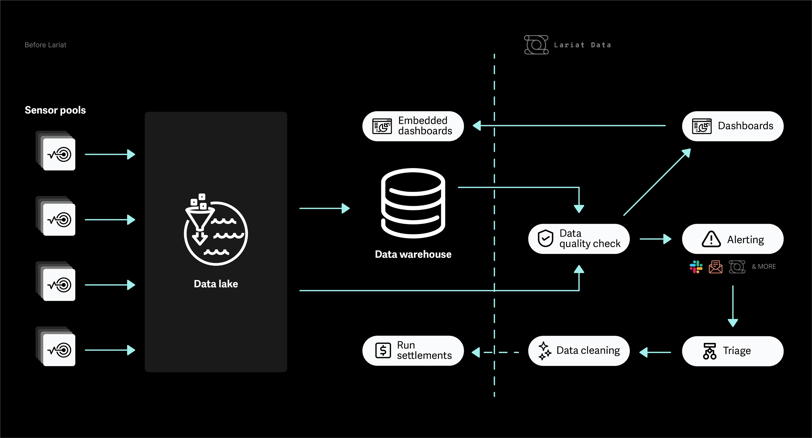
The Lariat Data platform enables clients to monitor data from multiple sources in a single, centralised location. As they reached a stage in their product lifecycle where they were ready to secure funding and scale, Lariat Data, with its engineering-only team, recognised the need for an end-to-end Product Designer. My task was bring a user-centric approach, elevate the platform’s professional appearance, set up a product team, and create design solutions to help achieve their sales and funding goals.
Chief Technology Officer x1
FE Engineer x1
Full Stack Engineer x1
BE Engineer x2
QA Tester x1
Data Scientist x1
Product Designer x1
(Isra Tabassum)
The team
Approach
Strategy
Phase 1
Phase 2
Quick wins
Experience
Discovery
With the app ready for VC meetings, I refined the roadmap for feature upgrades and the component library, then focused on UX/Product design based on those priorities. I also prioritised recruitment to ensure key product team members were hired on time, minimising disruption to the design process.
Workshops were held to gather business and user requirements, prioritising the most urgent ones. Additional sessions focused on competitor analysis and target users. With the funding round approaching, understanding key milestones became crucial, leading to the scheduling of various meetings and events.
To support the initial VC meetings, I focused on creating a professional brand identity and re-skinning the app. I conducted a component audit, prioritising only essential upgrades like accessibility improvements and critical UX fixes. This approach saved time while leaving a strong impression on users and VCs.
Phase 3
Goals
Persona


Ivan Lee
Data Engineer
Age
34
Organisation
Mid-sized digital health platform, California, USA
Background
Ivan holds a Master’s degree in Data Science from the University of Washington. She started her career in bioinformatics, but transitioned into product-focused data science roles. She's now embedded in the engineering team at Nexora, where she helps connect product decisions to performance and operational data.
Primary responsibilities
Monitor real-time application metrics and anomaly detection via multiple sources.
Collaborate with DevOps and backend engineers to identify performance bottlenecks.
Analyse metrics (latency, error rates, throughput) and connect them to user behaviour.
Design alerting rules based on historical usage and predictive modelling.
Communicate insights to product teams and leadership to support strategic decisions.
"Data is only powerful when it's trusted, timely, and leads to real action. Without that, it's just noise."
Pain points
Difficult to integrate data with user-level product analytics, leading to fragmented insights.
Misalignment between engineering and data teams when interpreting metrics.
Digging through logs and tracing distributed systems is time-consuming.
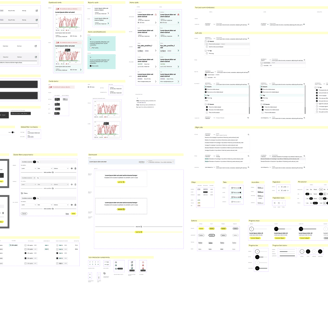
Component audit
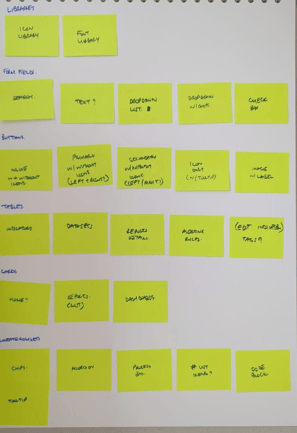
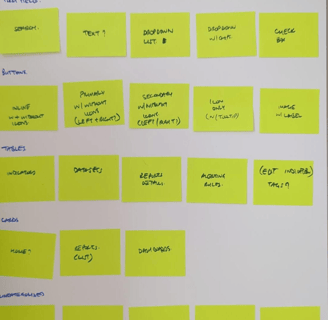
Design system
Sample only
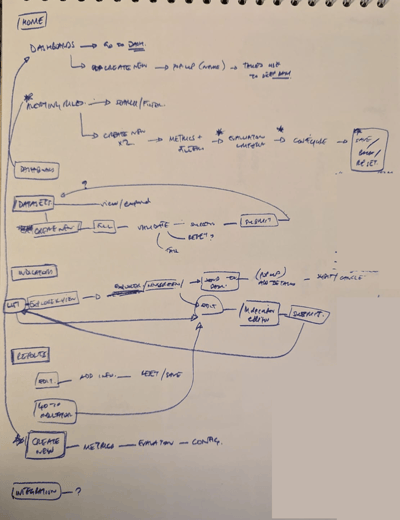
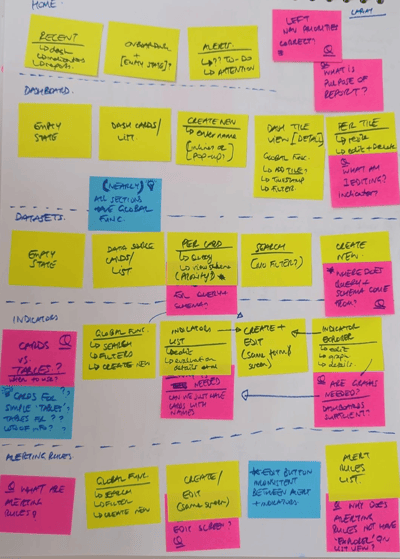
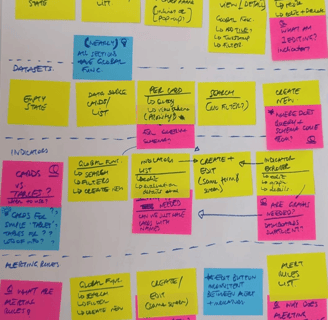
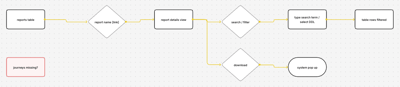
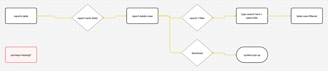
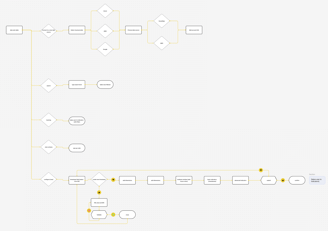
User-flow
Audit of previous app
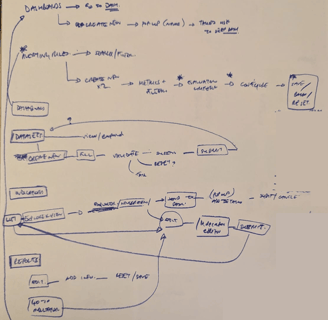
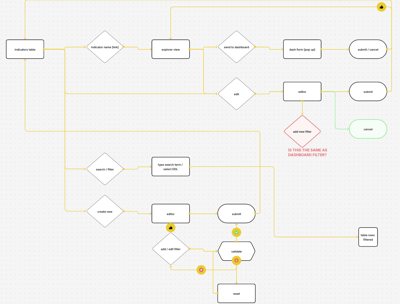
I began by sketching out the user journeys to gain a clear understanding, then digitally mapped them for the team to identify and address any UX issues.
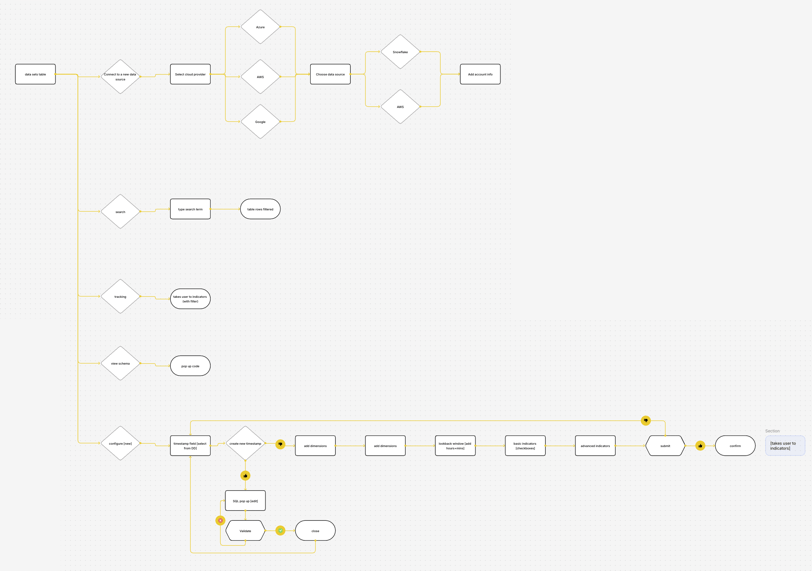
Updated app user flow
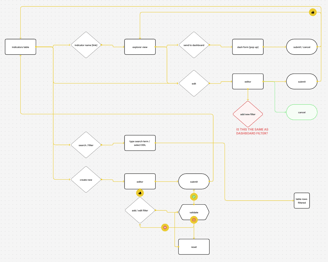
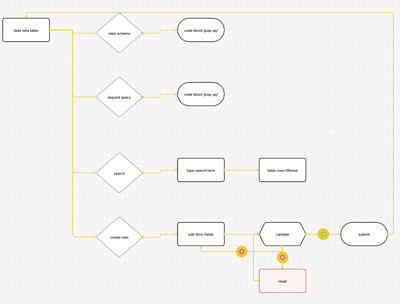
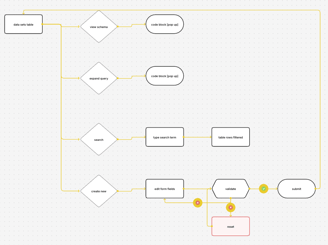
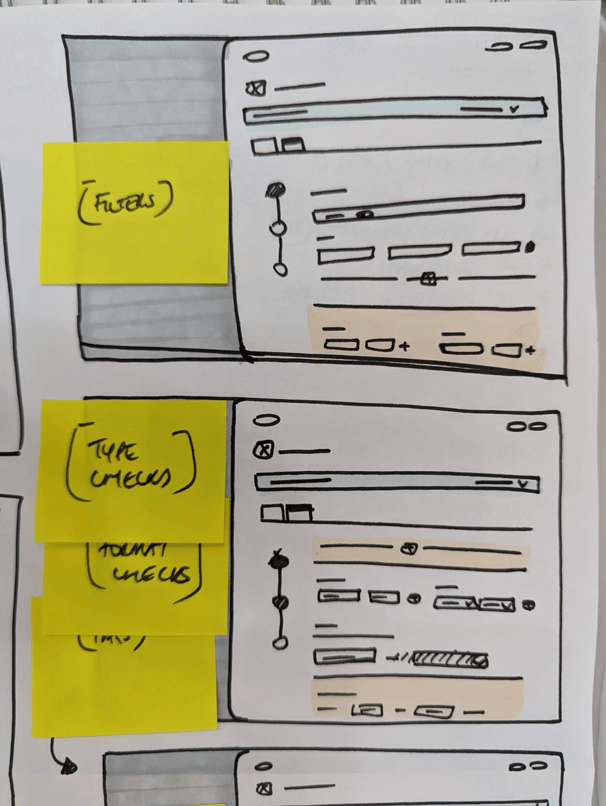
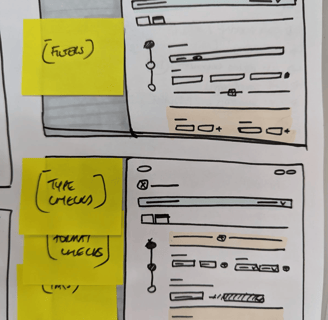
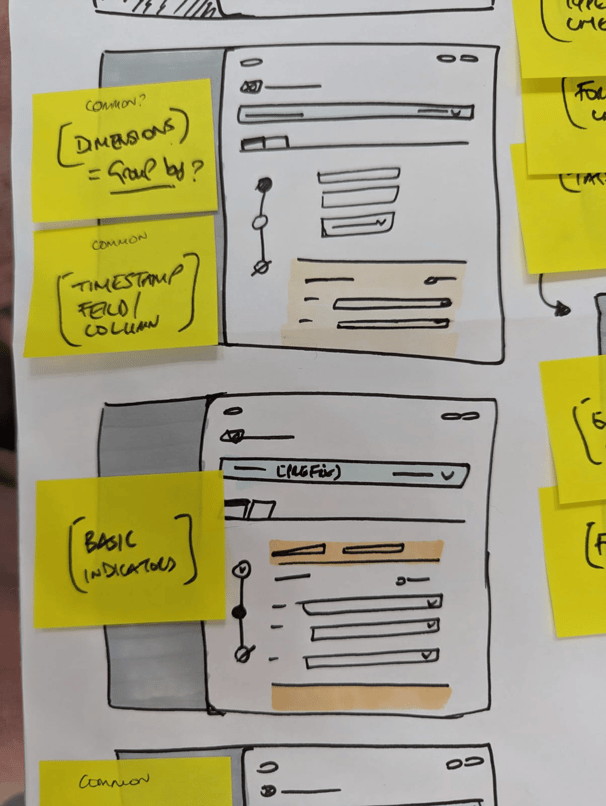
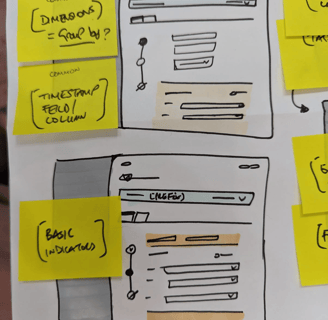
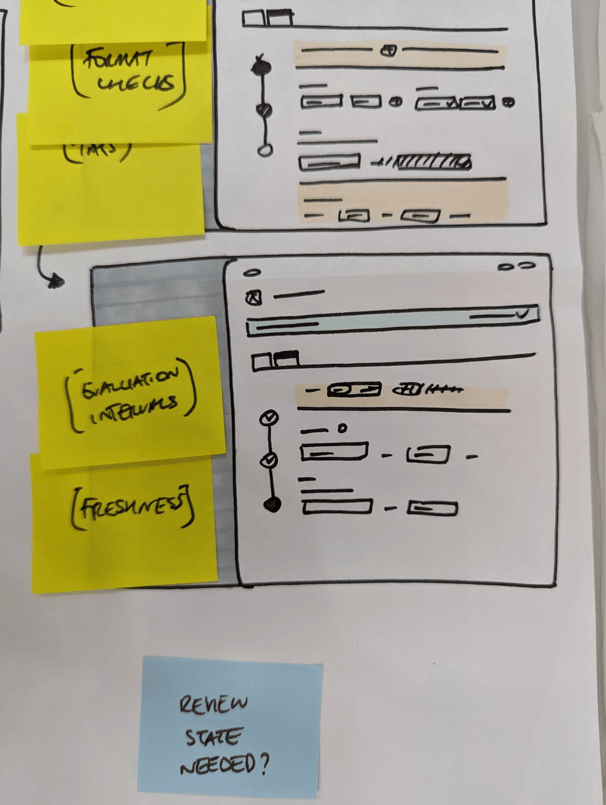
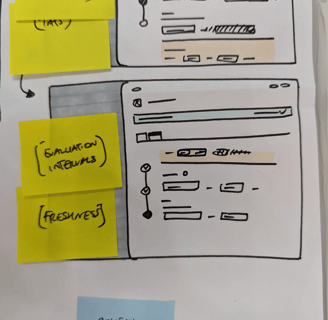
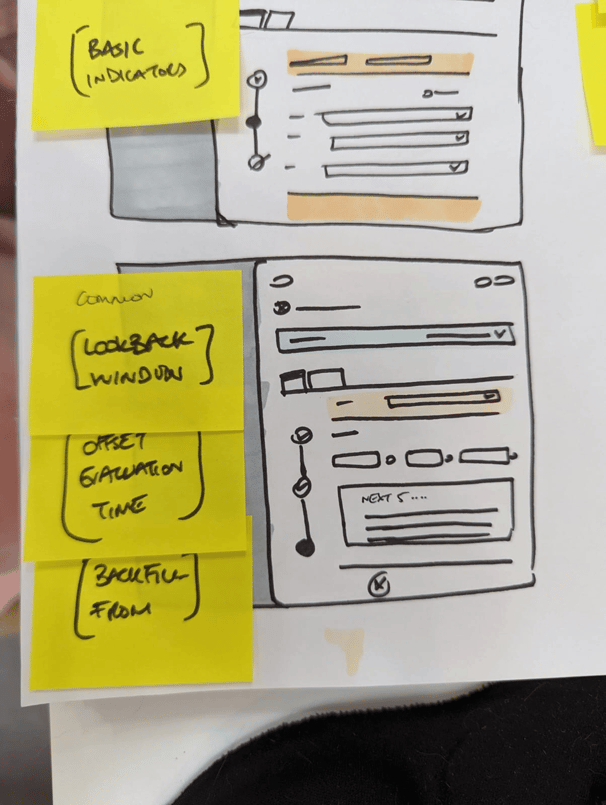
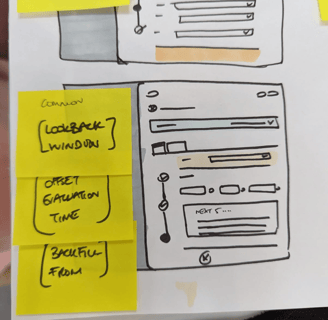
To be able to work out the best journeys and access for users, i started with sticky notes before mapping digitally and iterating further with the team.
Concepts
© Copyright Isra Tabassum 2025.